Netdata - A Free Infrastructure Monitoring Tool
Last night, I was taking inventory of my old Ubuntu 18.04 Intel NUC's Docker stacks & containers. I'm prepping it to start fresh and integrate into the Docker Swarm I run now. Anyway, I came across a container for Netdata. The container was listed as "unhealthy" in Portainer and I couldn't get it to start, so I headed to the internet to do some research.
It turns out Netdata has grown quite a bit from what I remember. As I recall, it was an on-prem server resource monitor. They now offer free cloud infrastructure monitoring through Netdata Cloud. What this entails is: running an agent on each node (server, workstation, VM, docker container, etc), which reports various metrics back to a dashboard running in the cloud.
The setup could not be easier. You start by visiting https://app.netdata.cloud and signing in with your choice of Google, GitHub or Email address. Next, you're greeted by an empty "War Room" with instructions on adding your first node:
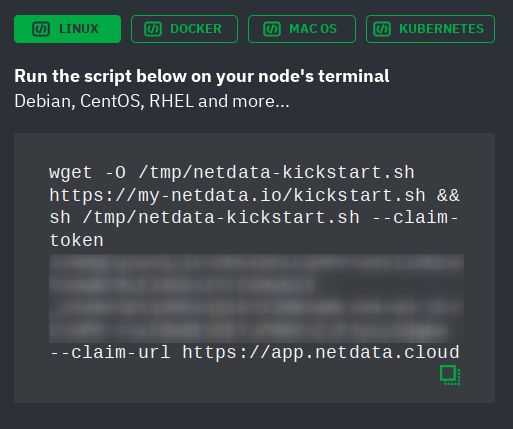
As you can see, there are options to install the agent to Linux, MacOS, Docker or Kubernetes. I chose the option for Linux, then copied & pasted the script into my terminal/ssh session. It did ask for my sudo password, but that was only used for installing packages through apt. You can examine the script yourself if you're wary. After the install completed, a new item appeared in my Netdata Cloud dashboard:
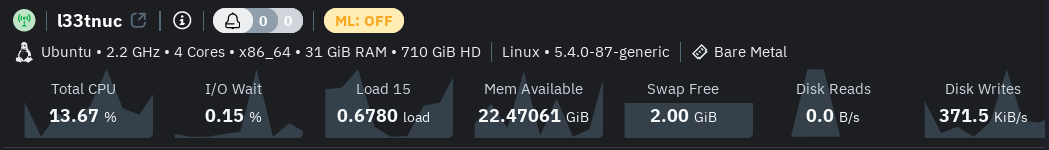
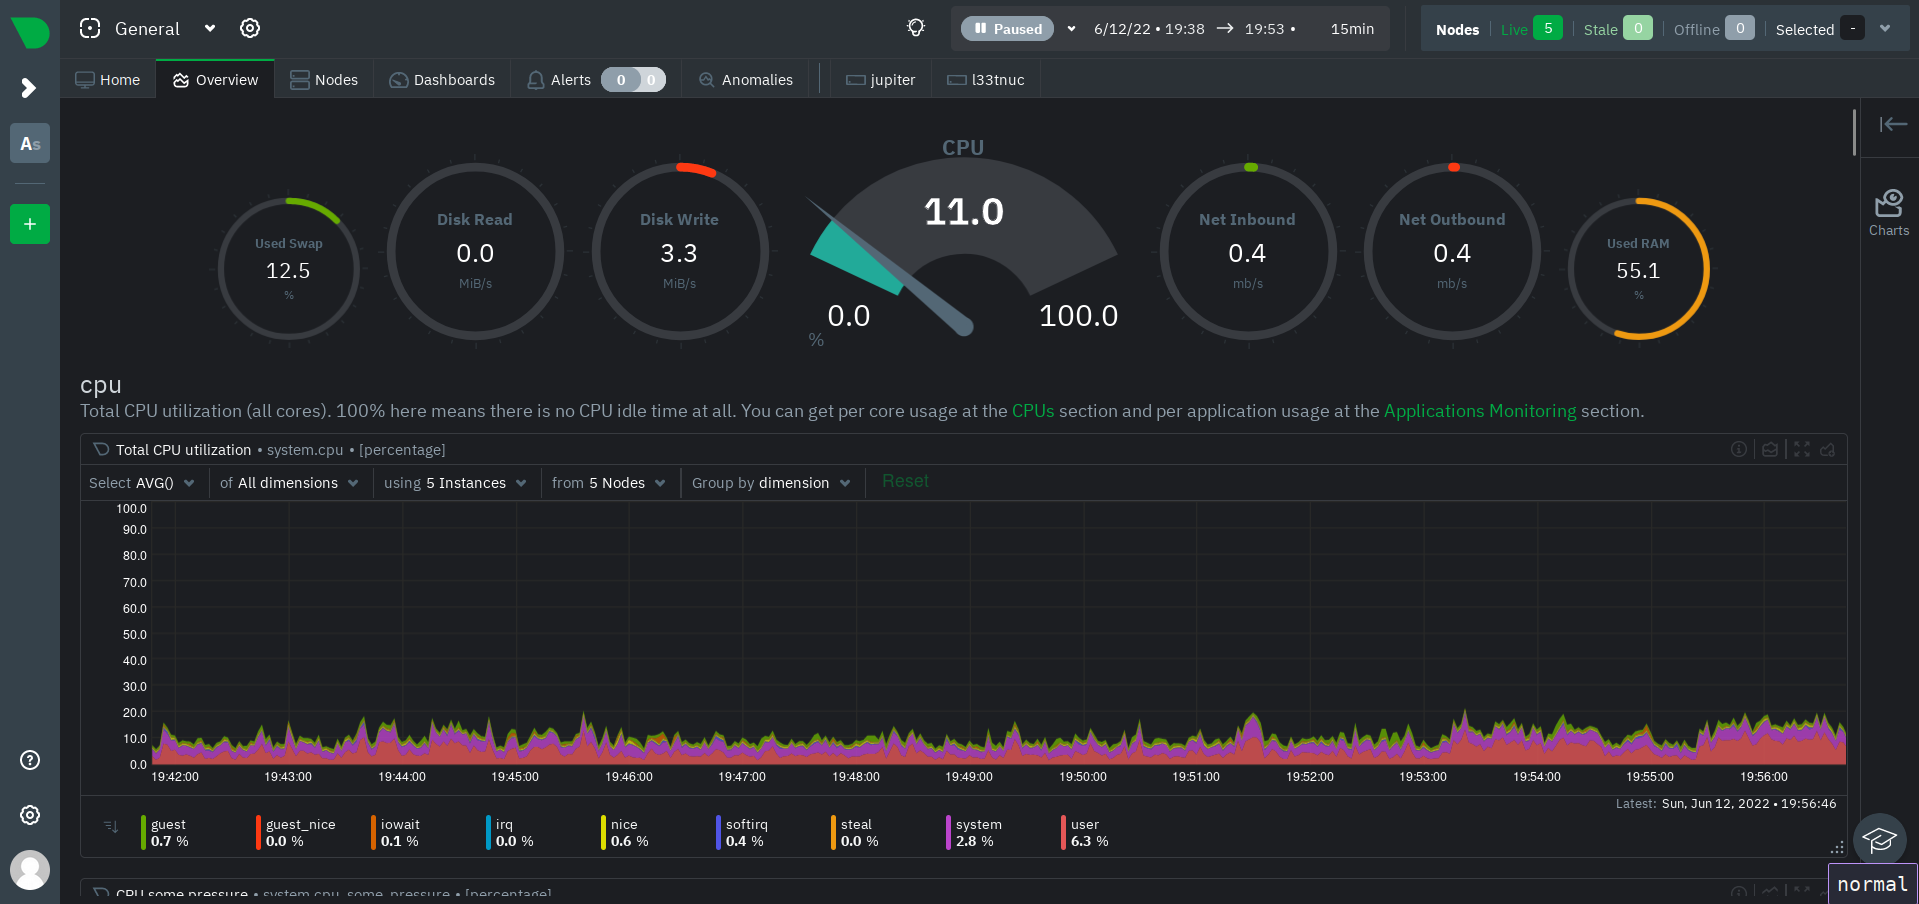
It took a few minutes for all of the fields (OS, CPU, RAM, etc) to populate. Once they did, I clicked on the new node to open it's individual dashboard. This is where things got really interesting! I was now looking at over 1200 beautiful charts! One for each metric collected by the Netdata agent:
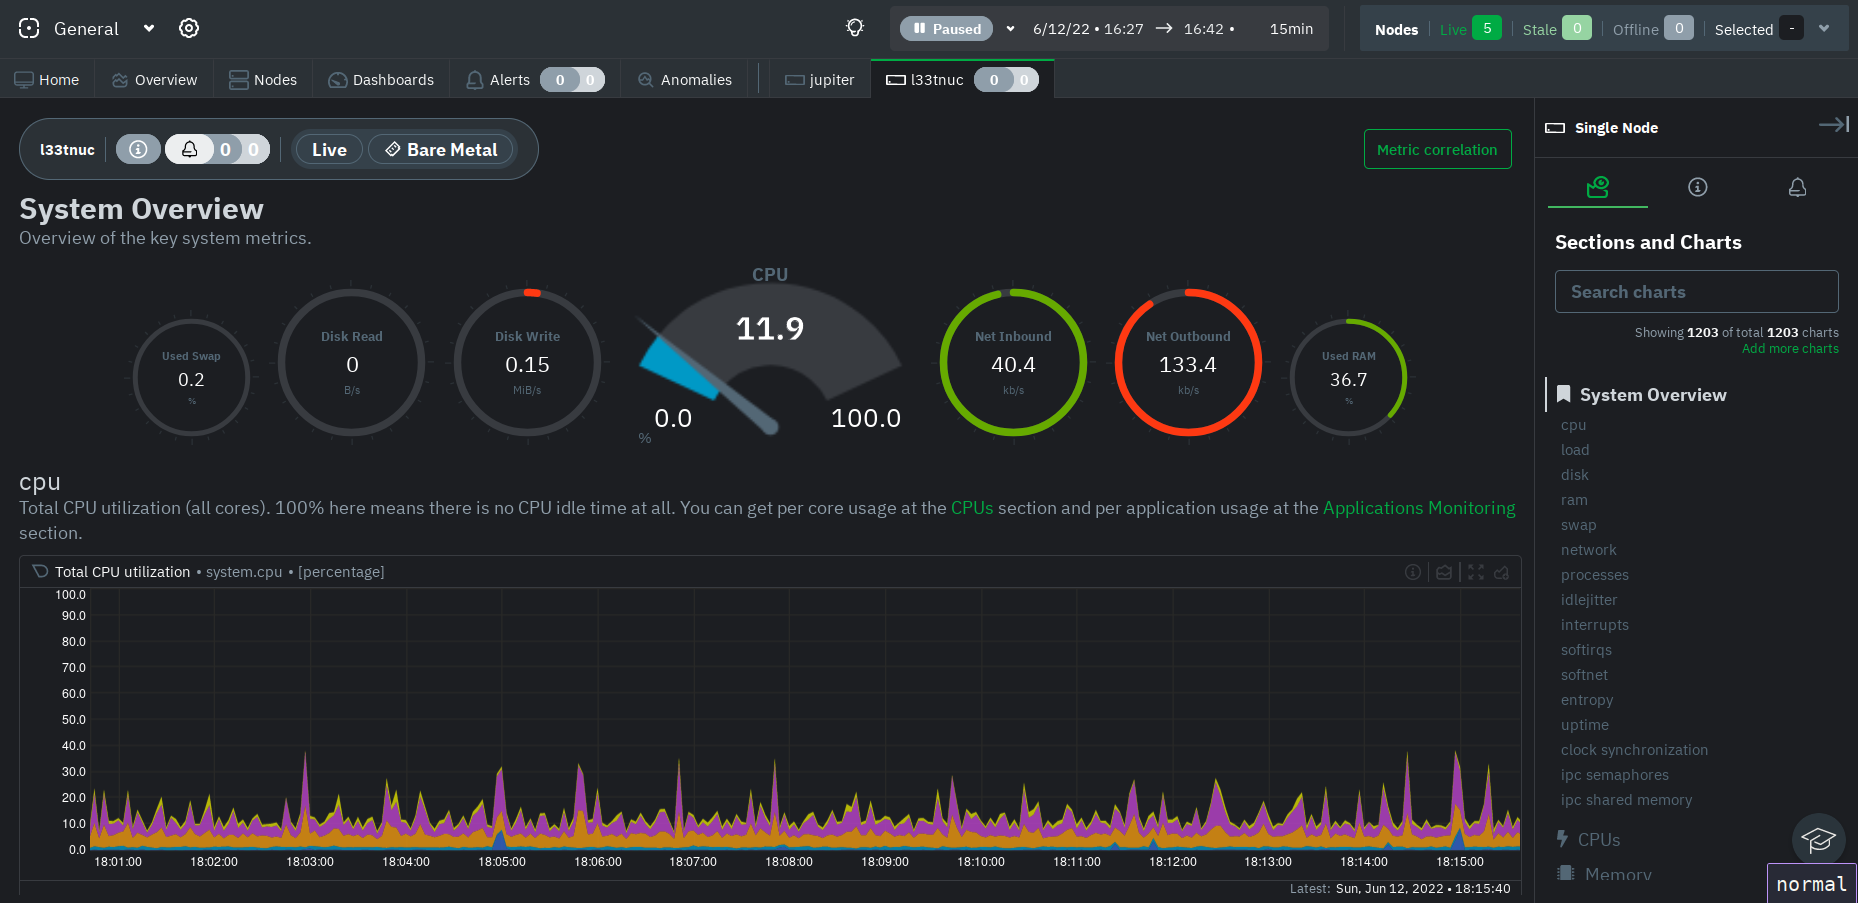
Right then and there, I decided I would install this on each Linux node I have running in my Homelab. You don't have to use Netdata cloud (though I don't see why you wouldn't): You can also monitor each node indivudally at http://node-ip:19999. According to Netdata's documentation, they are privacy-aware and no metric data is stored in Netdata cloud.
There's still a whole lot to uncover here. I already received a couple of RAM usage notifications via email this morning, so I want to see how I can fine-tune the alerting system. The Netdata documentation is quite detailed, so I don't imagine I'll have any problem finding what I need.
One final note: There isn't an agent that runs native on Windows, but it looks like one can get around that by using the Prometheus windows_exporter (supported) or WSL (unsupported).
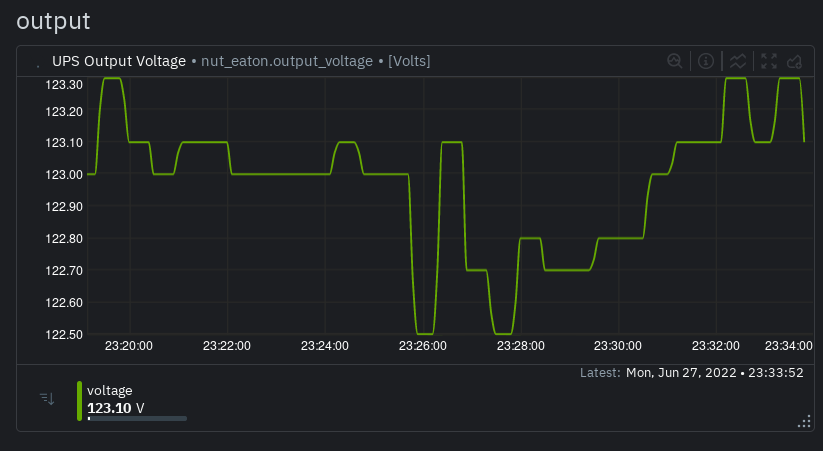
Update: I recently got a pair of UPSs that were being decommissioned by my employer. They're basically like-new! Anyway, I plugged them into my PowerEdge R630 server, which runs Proxmox (Debian), and setup NUT to monitor them. I had them configured for USB-passthrough to a VM running HomeAssistant and figured I'd monitor them through that. However, as soon as NUT was configured, the Netdata agent picked up the UPSs straight away! I didn't even know about it until we had a short power outage recently and, much to my surprise, I got an email notifcation from Netdata stating that my UPSs were running on battery power! The warning state cleared when power returned. So cool!
Have you had any experience with Netdata? Can you recommend a comparable solution? Let me know in the comments!